Anisotropic Turbulence Characteristics in Breaking Weak Surge Waves
Project Snapshot
- Project Title: Anisotropic Turbulence Characteristics in Breaking Weak Surge Waves
- Type: Research
- Project Report: View Article (PDF)
- Concepts:
- Large Eddy Simulation (LES)
- Volume of Fluid (VOF) Method
- Turbulence Anisotropy
- Reynolds Stress Tensor
- Anisotropy Invariant Map (AIM)
- Surge Wave Dynamics
- Duration: 2022
- Skills Developed:
- CFD Software: OpenFOAM
- Data Analysis: pandas, numpy
- Post-Processing Tools: ParaView, MATLAB
- Others: Compute Canada
Project Overview
1. Objective
To numerically investigate the anisotropic turbulence characteristics in breaking weak surge waves produced by the sudden removal of a gate, utilizing Large Eddy Simulation (LES) and Volume of Fluid (VOF) methods over a range of Froude numbers from 1.7 to 2.5.
2. Key Contributions
- Advanced Turbulence Analysis: Established turbulent statistics using Favre-averaging and conducted intricate anisotropy analyses through eigendecomposition of Reynolds stress tensors.
- Implementation of Anisotropy Invariant Map (AIM): Utilized AIM and characteristic ellipsoids to visualize and quantify turbulence anisotropy across the surge front.
- Insight into Mixing Mechanisms: Demonstrated that the production of turbulent kinetic energy is mainly sourced at the surge toe due to shear layer formation, highlighting the transition in anisotropy from the recirculating region to the mixing layer.
Introduction and Background
1. Surge Waves and Turbulence
- Surge waves are transient flow phenomena resulting from sudden changes in flow depth, velocity, or discharge, such as the abrupt removal of a gate.
- Breaking weak surge waves, occurring at Froude numbers between 1.7 and 2.5, exhibit complex turbulence characteristics due to interactions between mixing layers and recirculating regions.
- Turbulence in these waves is influenced by shear layers originating at the surge toe and the anisotropic behavior of turbulent structures.

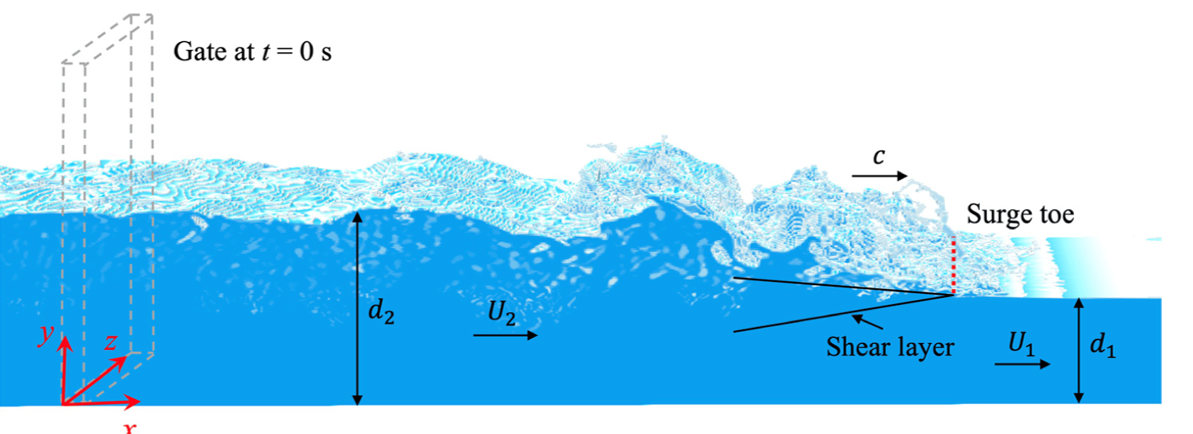
Figure 1: Definition sketch of the positive surge wave.
2. Research Motivation
- Detailed turbulent characterization near the interface and in the mixing layer of transient breaking surge waves is limited.
- Understanding turbulence anisotropy and its linkage to mixing mechanisms is essential for predicting flow behavior in hydraulic engineering applications.
- This study aims to meticulously investigate the spatial distribution of Reynolds stresses and anisotropy in breaking weak surge waves, filling a gap in existing research.
Methodology
1. Simulation Framework
- Software Utilized: Employed the
interFoamsolver within OpenFOAM for incompressible, multiphase flow simulations. - Turbulence Modeling: Implemented Large Eddy Simulation (LES) to resolve a wide spectrum of tempo-spatial scales down to the Hinze scale.
- VOF Method: Used the Volume of Fluid (VOF) method with the Van Leer Total Variation Diminishing (TVD) scheme for accurate interface capturing between air and water phases.
- Favre-Averaging: Established turbulent statistics using Favre-averaging, where quantities are weighted by instantaneous density to account for two-phase flow dynamics.
2. Simulation Setup
- Computational Domain: Designed a domain stretching from \( x = -25 \) to \( x = 25 \) meters to simulate surge waves produced by sudden gate removal.
- Initial Conditions: Generated using the Method of Characteristics (MOC) to accurately model surge wave formation and propagation.
- Froude Numbers: Simulated breaking weak surge waves with Froude numbers ranging from 1.7 to 2.5, focusing on the upper range of undular waves.
- Boundary Conditions: Applied appropriate boundary conditions to prevent reflections and ensure an accurate representation of the surge wave over an 8-second simulation period.
Results and Analysis
1. Flow Visualization and General Observations
- Vortex Identification: Utilized the Q-criterion to identify and visualize vortices and their evolution behind the surge wave in both space and time.
- Vortex Formation: Observed that vortices originate at the surge toe due to shear layer formation caused by velocity gradients.
Figure 2: Time evolution of the Q-criterion at the mixing layer and the breaking front of surge wave.
Figure 3: 3D evolution of Q-criterion isosurfaces of surge wave.

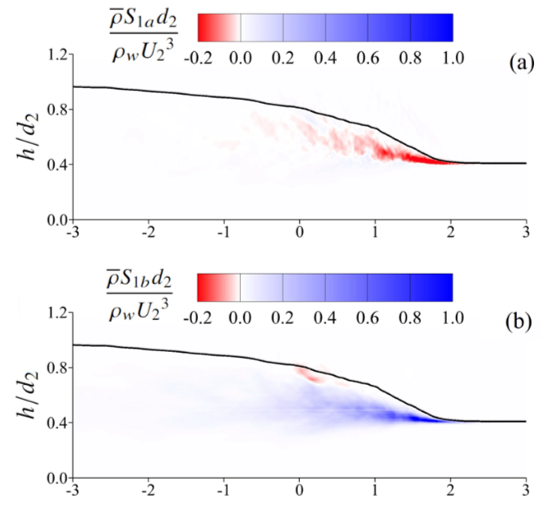
Figure 4: Turbulent kinetic energy production phenomena in surge waves.
2. Turbulent Kinetic Energy (TKE) Production
Primary Source of TKE: Found that the production of TKE is predominantly sourced at the surge toe, where the shear layer originates.
Shearing Action: Decomposition of production elements illustrated that shearing action is the principal driver of TKE production across the entire surge front.
3. Anisotropy Analysis

Figure 5: Anisotropy analysis of the wake of the surge front.
Anisotropy Invariant Map (AIM): Implemented AIM to study the states of turbulence by examining the invariants of the anisotropy tensor.
Characteristic Ellipsoids: Conducted pointwise eigendecomposition of Reynolds stress tensors to generate characteristic shape maps, revealing the degree and direction of anisotropy.
Anisotropy Transition: Near the toe at the core of the mixing layer, prolate structures stretched in the streamwise direction were evident. Moving toward the free surface, structures transitioned to a combination of prolate and oblate features, indicating changes in turbulent characteristics.
4. Turbulence Structure and Mixing Mechanisms
- Mixing Layer vs. Recirculating Region: Observed a clear transition in anisotropy from the recirculating region to the mixing layer, indicating distinct mixing features.
- Orientation of Principal Stresses: Near the toe, the largest principal stress was aligned in the streamwise direction. In the recirculating region, the smallest principal stress was aligned in the spanwise direction, affecting air entrainment and mixing.
Conclusions
Summary of Findings:
- TKE Production Dominance: Demonstrated that the production of turbulent kinetic energy is mainly due to the velocity gradient at the surge toe, driven by shearing action.
- Anisotropic Turbulent Structures: Identified varying anisotropic turbulent structures across the surge front, with prolate structures near the toe transitioning to mixed prolate and oblate features toward the free surface.
- Importance of Favre-Averaging: Highlighted that Favre-averaging and accounting for density fluctuations are crucial for accurately capturing turbulence in two-phase flows like breaking surge waves.
- Characteristic Ellipsoids: Provided detailed insights into the orientation and degree of anisotropy through characteristic ellipsoid maps, enhancing understanding of turbulent structures.
Implications and Future Work:
- Engineering Applications: The findings enhance the understanding of turbulence anisotropy in breaking surge waves, aiding in the design and analysis of hydraulic structures and environmental assessments.
- Further Research: Future studies should investigate other terms in the turbulent kinetic energy transport equation to deepen understanding of energy budgets in transient two-phase flows.
- Advanced Modeling Needs: Emphasized the necessity of using LES or Direct Numerical Simulation (DNS) for capturing the complex turbulence in surge waves, cautioning against models assuming local isotropy.
Final Remarks
This study provides comprehensive insights into the anisotropic turbulence characteristics of breaking weak surge waves. By resolving scales down to the Hinze scale using advanced LES and VOF methods, we highlighted the complex dynamics of turbulent structures and their transitions across the surge front. The research underscores the importance of meticulous turbulence modeling in transient two-phase flows, contributing valuable knowledge to both theoretical research and practical hydraulic engineering applications.